Running Reports
Overview
Reports in CustomBooks™ are located in the Reports menu. They are broken down by module and are also available in the menu for modules included in your edition of CustomBooks™.
Common Features Across Reports
Report Command Bar
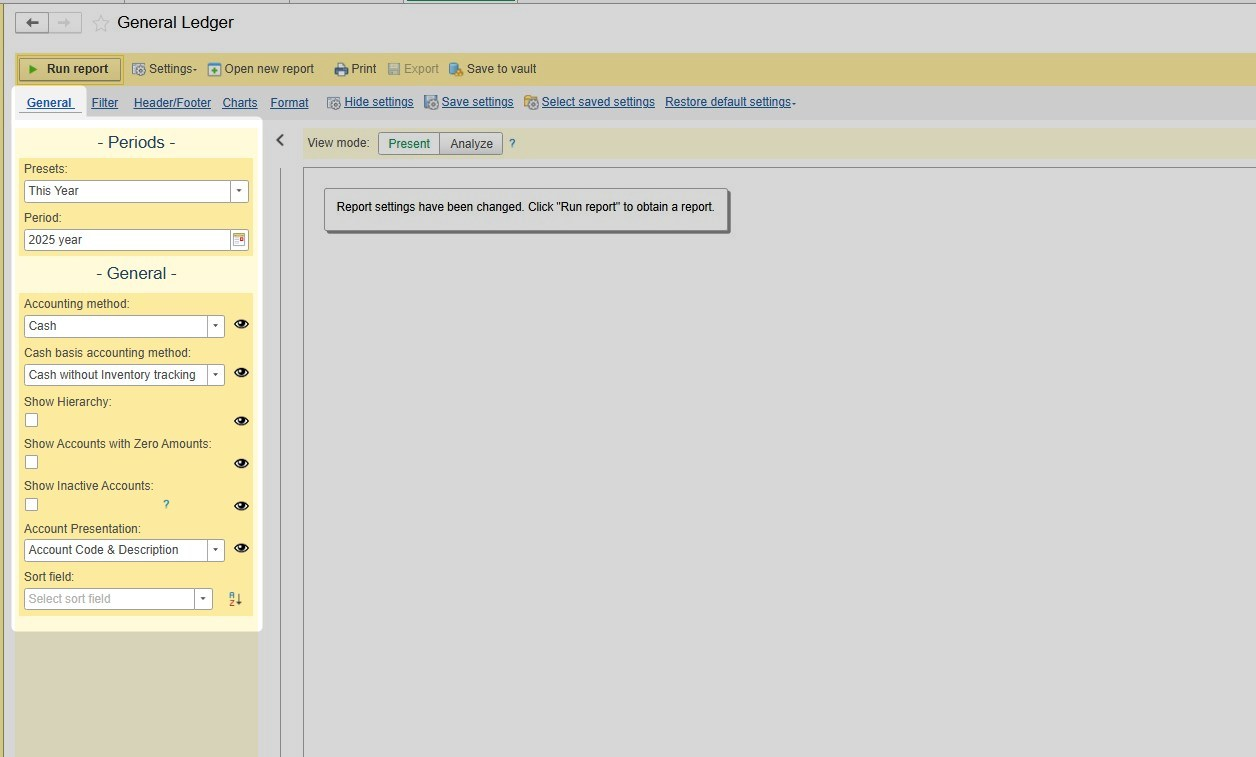
The Report Command Bar, the yellow bar at the top of your CustomBooks™ reports, offers key tools: Run Report, Settings (Save, Select Saved, Restore Default), Open New Report, Print, and Export.
- Run report - Run the report using the selected settings.
- Settings - This allows you to save report settings, retrieve and use previously saved report settings, or restore the report settings to the default.
- Open New Report - Opens a new report with default settings.
- Print - Print to a printer with the Print button.
- Export - Click the Export button to save the report in a variety of formats (PDF, XLSX, XLS, DOCX, etc).
Report Settings Tabs
General Tab
The General tab includes report-specific options, including accounting method, display options, sorting, and period selection.
Filter Tab
The Filter tab allows you to filter the report results by a variety of different factors that vary by report.
Header / Footer Tab
The Header and Footer tab allows you to add static text to the Header and Footer as well as change the title of the report.
Charts Tab
Using the Charts tab, create a variety of charts and graphs using the report data.
Format Tab
The Format tab includes page setup options and numeric and/or symbol formatting.
Hide Settings
The hide settings button hides the tabs and the report settings properties panel on the left. To restore them, click Show Settings in the Settings menu in the Command Bar.
Save Settings
The Save Settings button allows you to save all of the report settings for future use. Click Save settings, give the settings a name, and choose who can view and change the settings in the Save Settings dialog box.
Select Saved Settings
The Select Saved Settings button allows you to retrieve previously saved Report Settings for use.
Restore Default Settings
The Restore Default Settings button allows you to return the following subset of settings to their default status.
- General settings
- Rows/Columns settings
- Filter settings
- Header/footer settings
- Chart settings
- Format settings
- Levels structure setting
- All settings
View Mode
There are two view modes that can be chosen when running reports: Present and Analyze. Choose your view before running your report or switch between the two once the report has been run.
Present View Mode
The Present View Mode presents the report in a user-friendly manner and looks similar to a printed report. It is displayed using HTML, so this view is good for presenting to clients or analyzing the results. The web view mode has some limitations: Drill-down functionality is not available in this view, and the level will be shown at the highest level of detail and cannot be changed. Formatting is also not available in web view mode. This mode can be printed and exported to PDF, but not emailed directly at this time. Hiding variances and totals is also unavailable.
Analyze View Mode
The Analyze View Mode is good if you need to adjust the results or drill down deeper into the numbers. It is presented in a spreadsheet-like view. This view has full functionality with levels, formatting, and drill-down capabilities. This report will appear left-justified. This mode can be printed, exported, and emailed in various file formats.
Watch the video below for a visual representation of the view modes of the reports.
The Report Level Control
The Report Level control determines the detail at which the report will show. Click a higher number to see more detail or a lower number to see less detail.

Note: This is only available when using the spreadsheet view mode.
Show Variance
Some reports have a Show Variance toggle that can display variance in comparisons using actual amounts ($), percentages (%), or both ($+%). This can also be turned off.
Note: Variance can not be turned off in web view mode.
Formatting Buttons
The formatting buttons allow for the formatting of certain text in the Header/Footer and Title sections of the report. Unfreeze will cause the header to scroll when viewing the report.
Note: Formatting is only available when using the Analyze View Mode.
Advanced Report Settings
To change the structure of the report, use the Advanced Settings option in the More Actions.
To run a report:
- Navigate to the appropriate module in the Reports module and choose the report to run.
- Choose a time range in the Period dropdown (if applicable). For custom date ranges, choose Custom and enter the Start and End dates. Note: This setting differs per report. Some have a date range, others a single date, and others a period selection.
- Click General tab or Filter tab and choose the report filtering needed.
- Click Run Report.
- Export to Excel or PDF by clicking the Export button. (optional)
- Print by clicking the Print button. (optional)
- Send via email by using the Send button (optional)
Report Tips and Tricks
- In many reports, clicking a figure in the results will allow you to drill down to see what transactions make up that total.
- To hide the report parameters from appearing in the results, click the eye icon in the report setting properties window next to the parameter.
- To choose more than one option from a dropdown, choose Open selection window and check the checkboxes of the items to include.
- To change the precision (number of decimals shown), zero and negative number presentation, highlight a figure(s), and click Format current numeric field*.
Need help applying this to your business?
See how CustomBooks™ can support your accounting and inventory workflow
If you are evaluating CustomBooks™ or want help setting up workflows for your business, explore the product or schedule a conversation with our team.
Already using CustomBooks™? Explore the Knowledge Base or contact support for product help.
Related Articles
CustomBooks™ Reports
Reporting CustomBooks™ has a complete set of financial, operational and project based reports. Our advanced reporting customization features allow you to create the report you want. To run a report, Navigate to Reports → Report Category (Ex. Sales) → ...Assembly Bill of Materials Report
Overview If you have ever wanted to see a quick look at what assemblies a product is used in, this report will do the trick. Complete the steps below once and save, and you can run the report whenever you need it. The report will be grouped by ...AccountingSuite™ Product Perks: May 2024 - Financial Comparative Reports
Financial Comparative Reports Open cbdee363-686a-425d-9459-f15fc928e703.gif This month’s Product Perks video highlights our Comparative Financial Reports. Checking to see how you’re doing in relation to past periods is always a good thing and these ...Cash Basis Method of Accounting
Cash Basis accounting registers were updated in 2025 to align with the American Institute of Certified Public Accountant’s (AICPA) “modified cash basis”, simply referred to as “cash basis” by the accounting profession. This method of accounting is ...Inventory Details: Item Costs, Item Quantities and Location Information
Inventory Details Overview Understanding inventory details, such as item costs, quantities, and location information, is essential for effective inventory management. Accurate insights into these details ensure proper stock control, cost tracking, ...